



I was working on getting SNMP data into Grafana, using the nine-node K3s cluster in my lab. K3s runs the containers, and Longhorn keeps copies of their storage volumes on different workers. Before I could finish the monitoring setup, I had to sort out why those workers kept losing traffic between datacenters.
I had already changed the MTUs and switched the Cisco routers to virtio interfaces. I thought I had checked the network after those changes. Then SPE3, one of the routers in my service-provider core, stopped receiving packets on both core interfaces. Both still showed up, and their transmit counters kept increasing.
Rebooting SPE3 brought IS-IS back up and the large pings started working again. IS-IS is the routing protocol my core routers use to discover neighbors and calculate paths. But the receive counters stopped a second time. Meanwhile, the K3s nodes could report Ready while Longhorn rebuilds stalled and TCP kept retransmitting.
So I started following the packets through the virtual topology. That took me into QEMU, the process emulating the Cisco router hardware, and then into the Linux networking inside the Arista switches. I found a receive stall in the first and malformed combined TCP segments in the second. Getting past the QEMU problem was what let me see the leaf problem clearly.
I’ll walk through the captures and checks below. There is still a storage-load issue to investigate, so I’ll also show where the successful tests stopped answering the question. The companion Part 7 implementation post covers the SNMP collection system I built on the recovered lab.
Following the retransmissions down to a virtual NIC
The C8000V routers were using virtio, a network interface designed for virtual guests, with data-port maximum transmission units (MTUs) of 9216 bytes. I kept that configuration while checking the receive failure. I wanted to change one thing at a time and see what it did to the same failing traffic.
The MTU sets the packet-size limit at an interface. My lab uses jumbo frames, larger than the usual 1500-byte Ethernet setting. TCP breaks a transfer into segments and sends bytes again if they are not acknowledged. Those retransmissions told me the transfer was having trouble, but I still needed to find where the packets were being lost or damaged.
Map the layers the connection crosses
Take a connection from a K3s node in DC-A to one in DC-B. Both Linux VMs run on Proxmox. Their data interfaces connect to Arista vEOS leaves in EVE-NG, while the Cisco C8000V core runs in Cisco Modeling Labs (CML). A leaf is the switch the server connects to.
There are VMs inside VMs here. Proxmox hosts CML, and CML hosts the emulated routers. That means “the host” depends on which part I am checking: the CML VM is a guest from Proxmox’s point of view, but it is the host running the router’s QEMU process.
In the diagram, follow the connection from the source VM into its leaf, across the datacenter switching fabric, and through the CML core toward the other site. The management connection is separate. I could still use it to log into the devices when this data path stopped working..
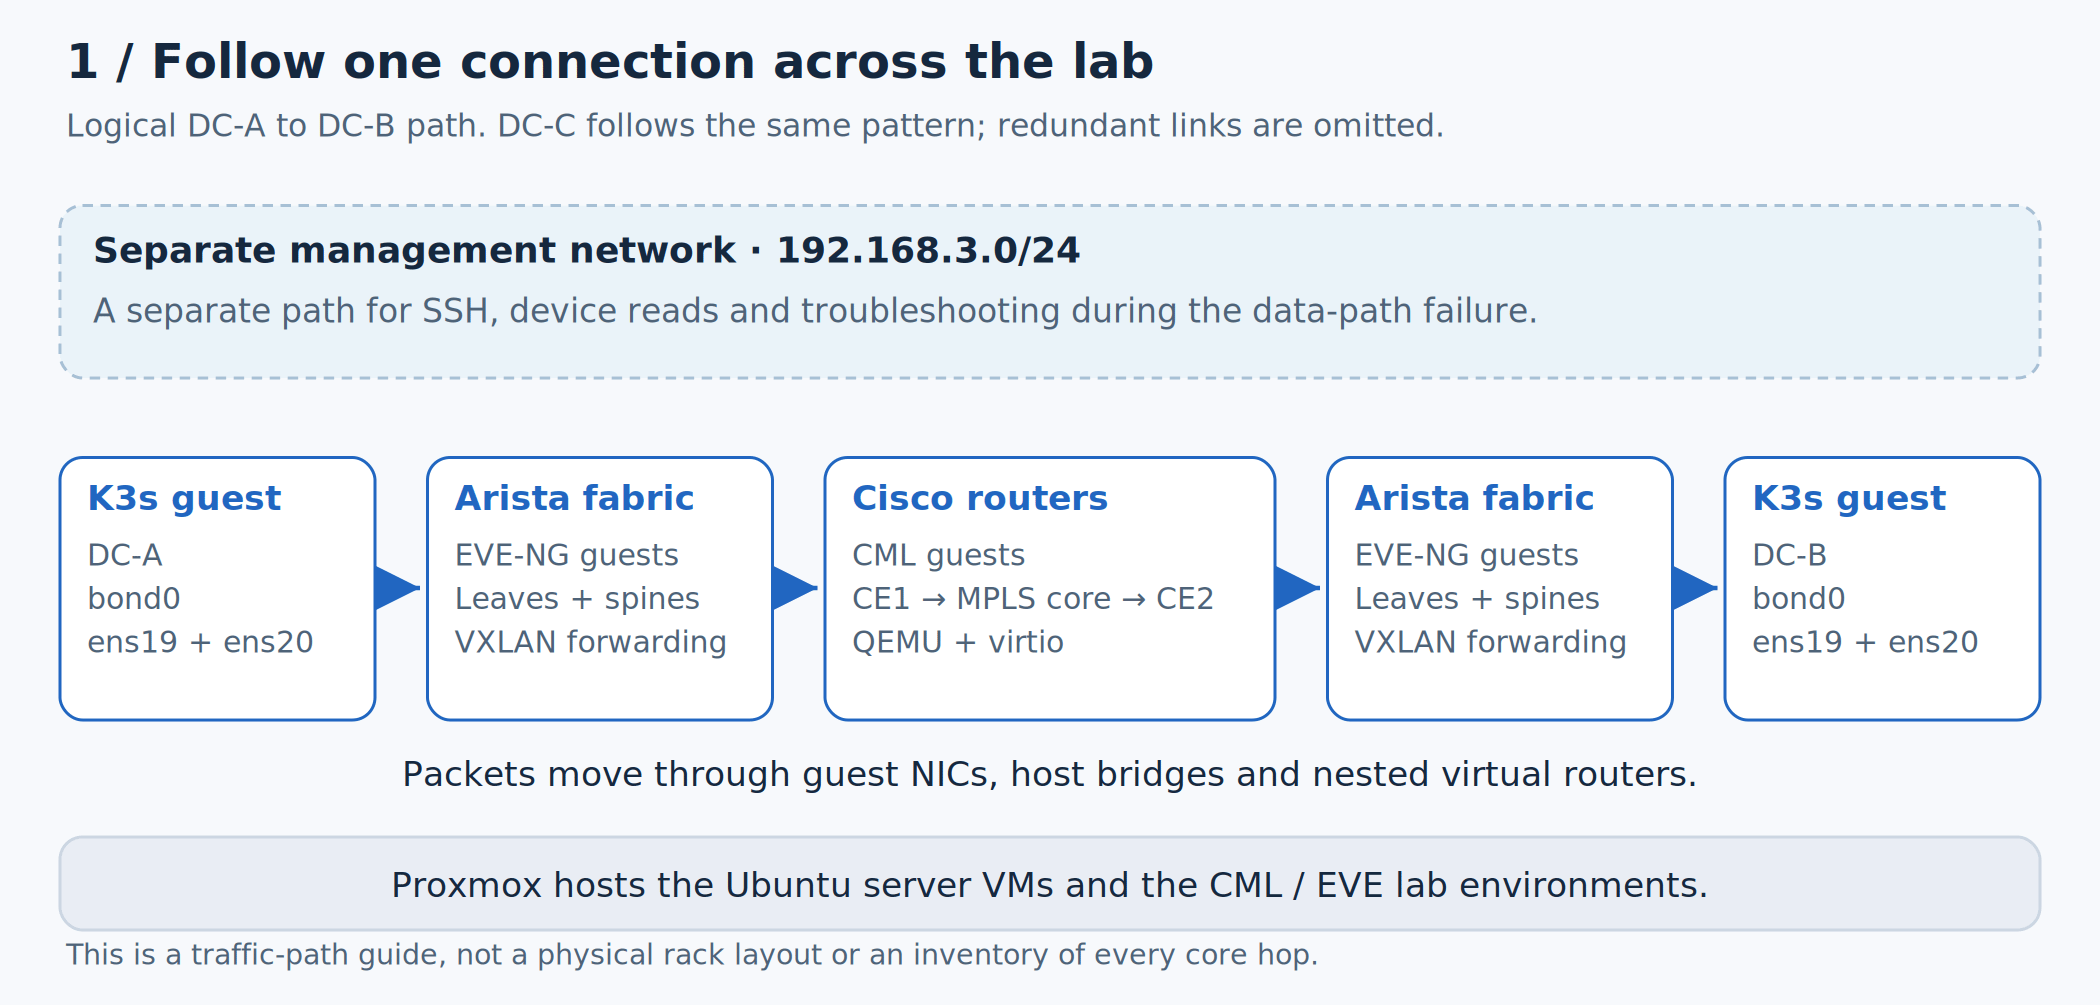
Figure 1. I followed the data connection across each virtualization boundary. This simplified view omits redundant links and individual core hops; the management network is a separate diagnostic path.
The routing state helps identify which part of that path is working. In the core, I checked IS-IS adjacencies, the neighbor relationships between routers. BGP distributes routes, and its EVPN extension carries information about endpoints in the datacenter overlay. VXLAN is the tunnel carrying the original Ethernet frame across the underlying IP network. I needed to account for that wrapper when checking packet sizes and captures.
Account for the headers between layers
The host’s data interface is set to 9000 bytes, but Flannel, which connects Kubernetes pod networks, is set to 8950. That leaves room for Flannel’s tunnel headers. The router data ports are set to 9216. Follow the packet through the diagram and the different sizes make sense: each layer needs room for whatever the previous layer added.
TCP has another size to consider: maximum segment size, or MSS. This controls the amount of data in each TCP segment. I used it to send small segments and jumbo segments over the same path and compare the results.
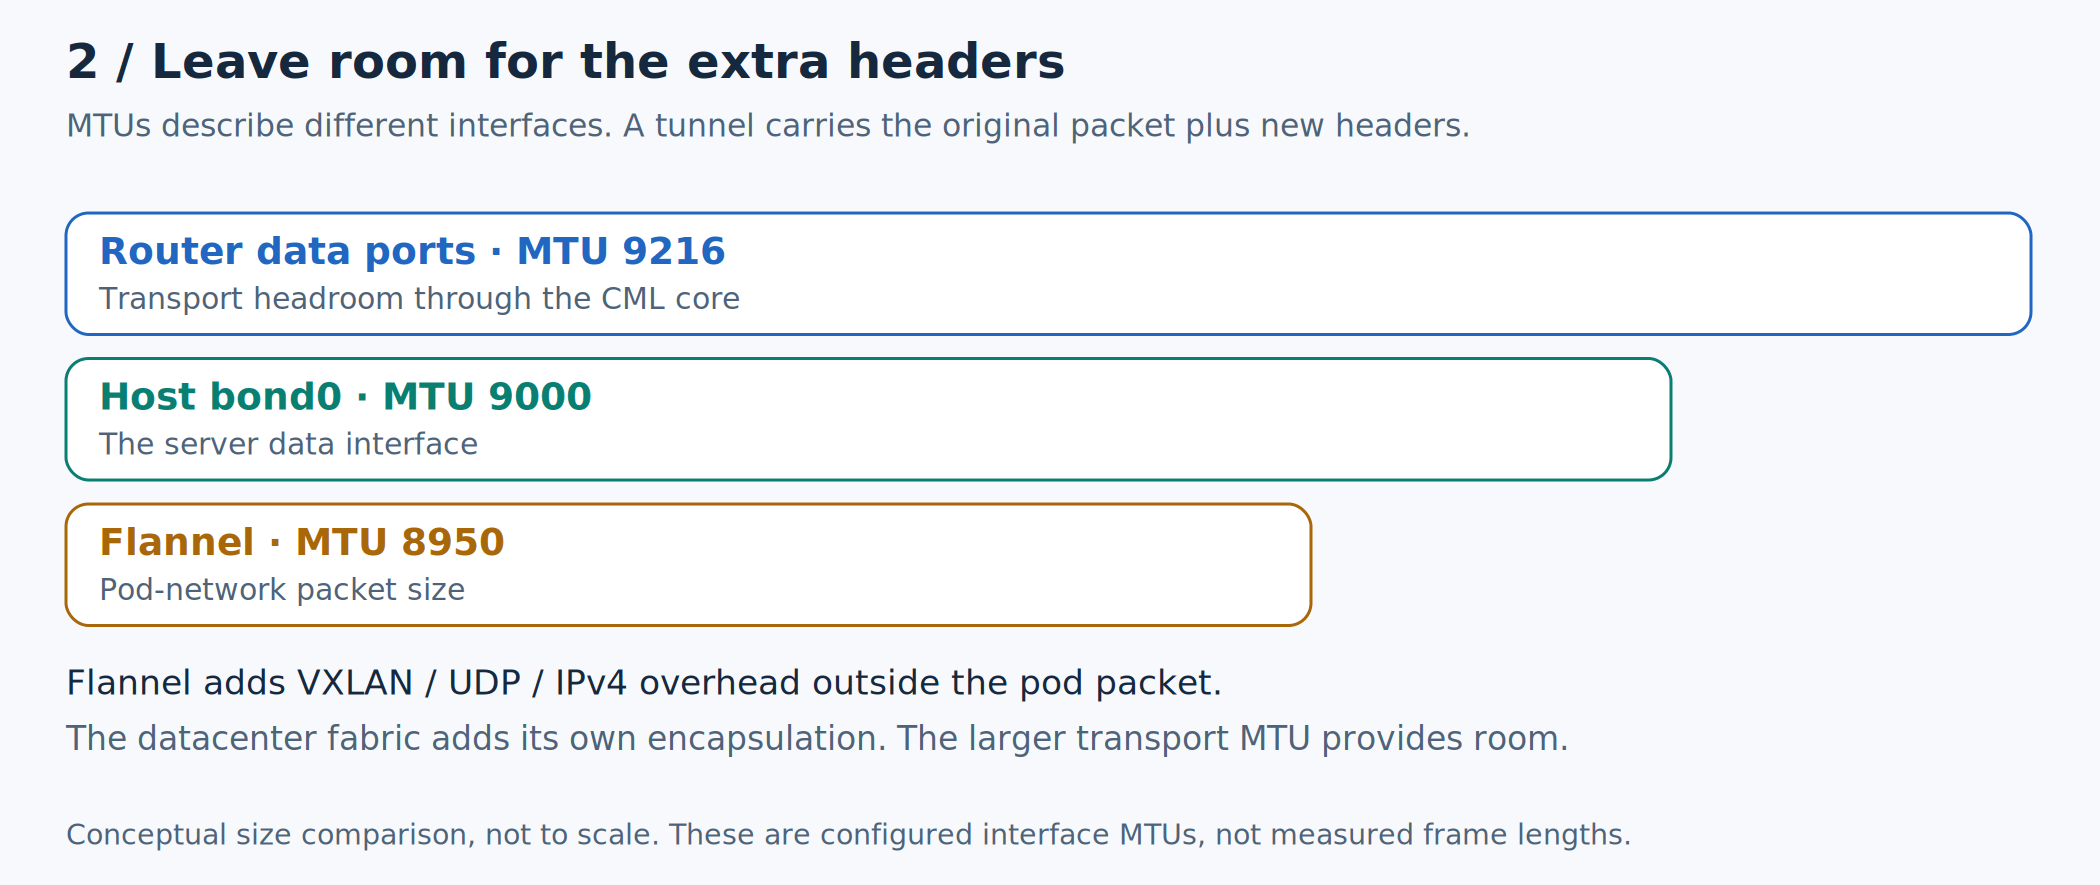
Figure 2. I compared the limit at each layer. The different values leave room for encapsulation; they are not conflicting measurements of one packet.
I planned to capture the same traffic at the K3s guests, Proxmox, EVE and the CML core. For each path, I attempted four transfers, alternating requested MSS values of 1200 and 8960. Each sent 256 KiB in each direction at 1 Mbit/s. KiB and MiB describe amounts of data in binary units; Mbit/s describes millions of bits per second. I limited the rate because I wanted to check delivery before testing capacity.
Neither the DC-C to DC-A connection nor an alternate DC-B to DC-A connection established TCP. I could not compare the transfer rates yet. I went back to the core router that had stopped receiving.
Locate the stop inside CML
On SPE3, both core interfaces still showed up/up and MTU 9216. Look at the counters, though: transmitted packets kept increasing while received packets did not. Management traffic and the CE3-facing interface were still receiving. The failure affected the two core interfaces.
Both IS-IS neighbors were gone, and the BGP sessions to the route reflectors were Idle. Route reflectors redistribute routing information among BGP peers. Losing those sessions along with the receive counters pointed me toward the core interfaces, even though they still showed up/up.
I captured the SP1-SPE3 and SP3-SPE3 links in CML. Both ends were sending IS-IS hellos, the messages used to discover and maintain neighbors. The captures included Ethernet frames of 9229 bytes. That length includes link-layer overhead, so it is not the same number as the IP MTU.
The hellos were there on the links. I then needed to check whether QEMU was delivering them into SPE3.
I then checked how CML was passing those packets into SPE3. These interfaces use QEMU UDP sockets over loopback, so packets move between processes on the CML host. They do not need to leave CML and cross the outer Proxmox-to-EVE connection for this hop.
The sockets feeding the two failed interfaces had growing receive queues, roughly 12 MB and 15 MB of kernel queue accounting in the samples. The sockets for management and the CE-facing interface had no backlog. Packets were reaching CML and waiting there while the router’s receive counters stayed still.
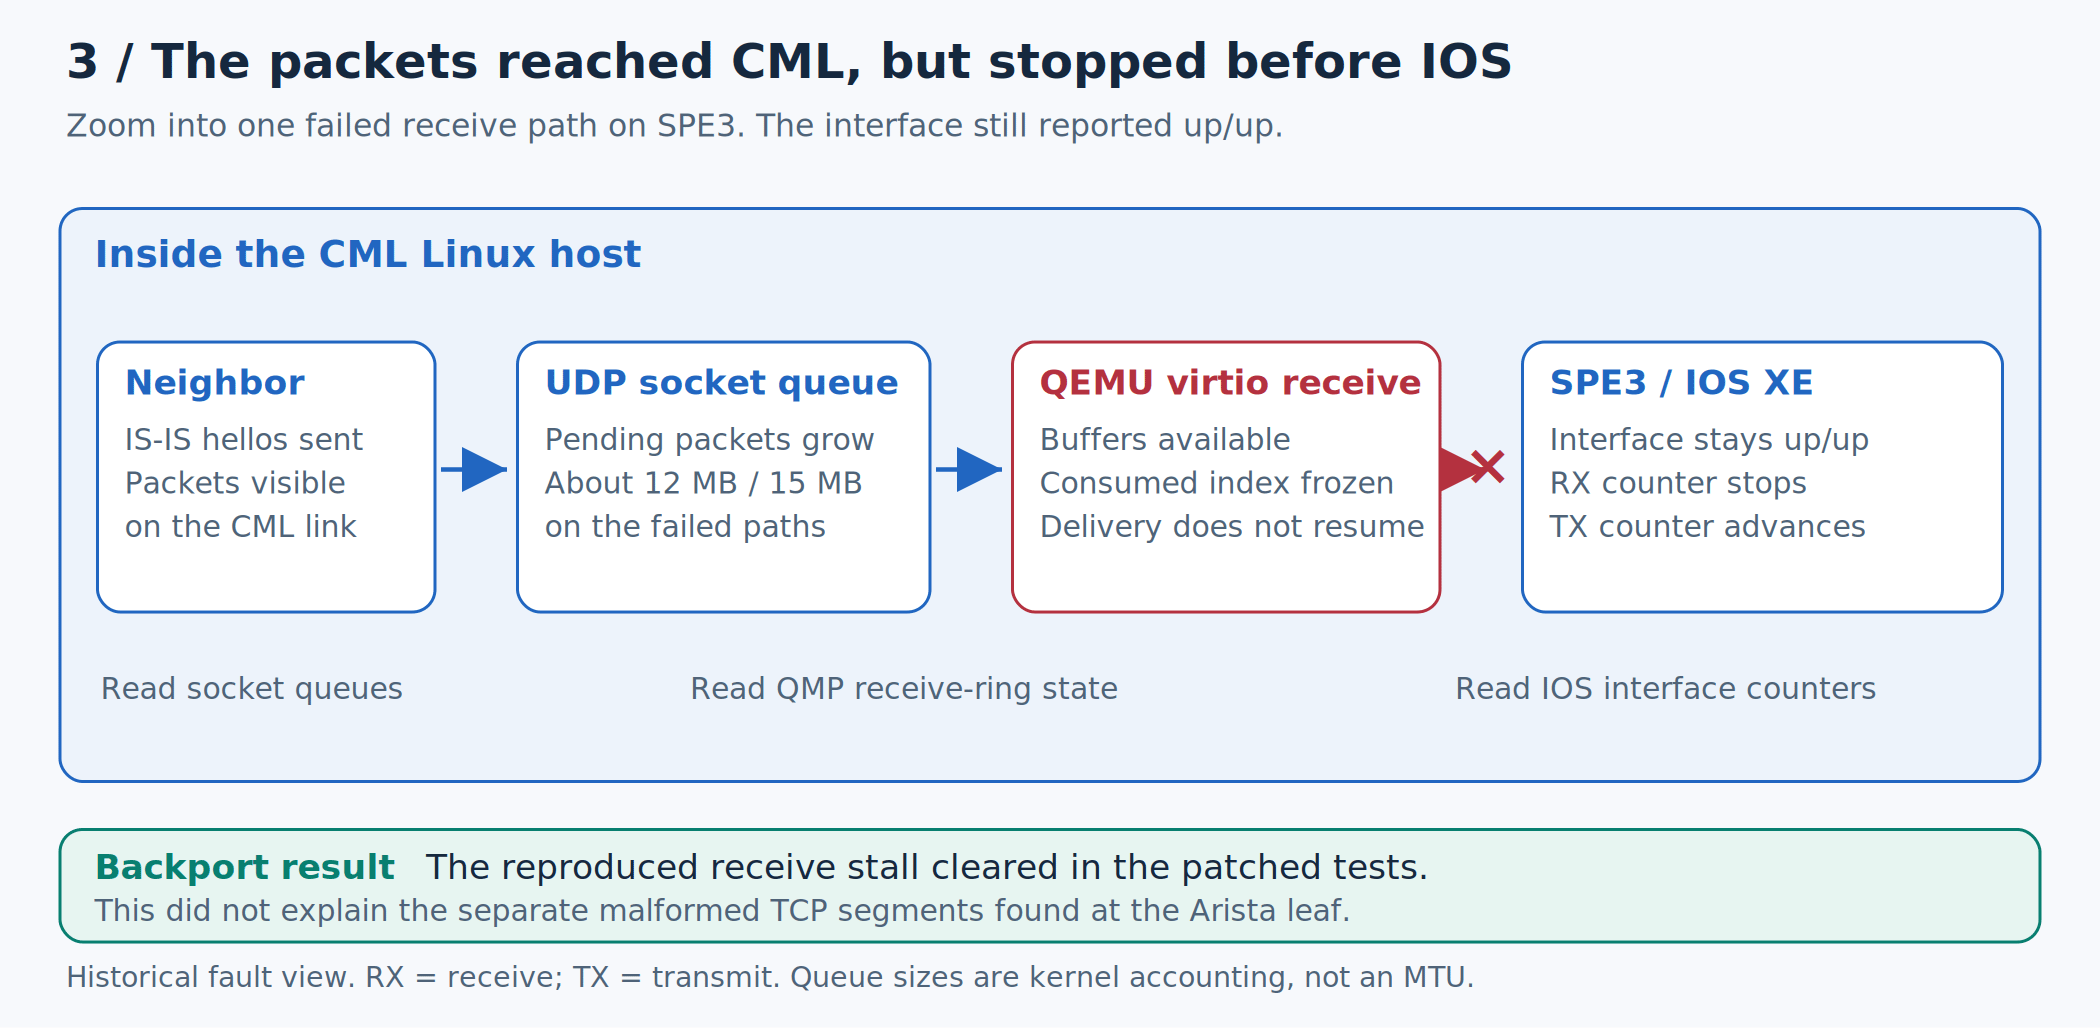
Figure 3. I narrowed the receive stall to the boundary between queued packets on the CML host and delivery into SPE3. The QEMU backport repaired this reproduced failure; it did not explain every later retransmission.
Here are the read-only commands for comparing the router’s counters with the CML host’s sockets and running executable. Run the IOS commands inside SPE3 and the Linux commands on the CML host. In the latter, <router-pid> is the process ID of the affected router’s QEMU process.
! Inside the SPE3 IOS console
show interfaces GigabitEthernet2
show interfaces GigabitEthernet3
show isis neighbors
# In the Linux shell of the CML host
sudo ss -u -a -n -p -m
sudo readlink /proc/<router-pid>/exe
sudo sha256sum /proc/<router-pid>/exe
In the ss output, I looked for the sockets owned by SPE3’s QEMU process and matched them to the affected NICs. A total for every socket on the host would not tell me which interface was stuck.
The /proc/<router-pid>/exe checks answer a different question: which executable is this router actually running? Replacing /usr/bin/qemu-system-x86_64 does not replace the code already loaded by a running process. SHA-256 gives me a fingerprint of the executable so I can compare the running copy with the one I tested.
The next place to look was QEMU’s receive ring. This is the set of buffers, regions of guest memory, that the router makes available for incoming packets. QEMU uses counters to track its position in the ring. These counters are 16 bits wide: after 65535, they return to zero.
The failed interfaces were all close to that rollover: three interfaces across two routers. Working interfaces kept advancing through their counters, so I compared the stuck ones more closely.
I read those counters through QMP, the QEMU Machine Protocol, using virsh qemu-monitor-command. virsh talks to libvirt, the VM-management layer. The QMP operation x-query-virtio-queue-status showed the consumed and cached available indices for queue 0 of each mapped NIC.
A name such as /machine/peripheral/net2/virtio-backend is a device path inside QEMU. It is not a Linux file, and net2 needs to be matched to the router’s actual interface. I saved the queue-status readings before inspecting individual entries with x-query-virtio-queue-element, because that deeper check also refreshes QEMU’s cached available index. Here are the original readings:

Both SPE3 interfaces had a full set of 256 buffers waiting in the guest. The head buffers were 2060 bytes each, and the guest and QEMU had negotiated mergeable receive buffers, allowing several buffers to hold one large packet. There should have been space for the jumbo frame.
QEMU also reported that the NICs were enabled and unbroken. I sampled them again: the consumed indices stayed frozen while working interfaces advanced. Inspecting the individual queue entries refreshed the cached index, but did not get reception moving.
Why a counter rollover looked like an empty queue
The guest had supplied receive buffers, so why was QEMU behaving as though there was nowhere to put the packet? I followed that question into virtqueue_num_heads() and virtqueue_split_get_avail_bytes() in QEMU 8.2.2. These functions help work out how many buffer entries are available and whether they provide enough space for the incoming packet.
The guest advertises its available buffers through a counter. QEMU keeps a cached copy so it does not have to reread guest memory for every check. “Cached” means a previously read value; it can fall behind when the guest supplies more buffers.
The scan has its own counter as it adds up the available space. This was the comparison I initially suspected: the guest’s counter wraps after 65535, but the scan uses a wider unsigned integer and can keep counting. “Unsigned” means it cannot be negative. Here, the important difference was what happened when one counter returned to zero and the other did not.
For SPE3 Gi2, the scan started at 65535 and the cached available counter was 1. In a 16-bit counter, those positions are only two steps apart:
Scan position using the wider integer:  65535 → 65536 → 65537
The same position expressed in 16 bits: 65535 →     0 →     1
Cached available counter:                                  1
Follow the two rows in that example. After two buffers, the wider counter reaches 65537 while the cached counter is still 1. Comparing 65537 == 1 returns false, so the scan does not take the branch that refreshes the cached value from guest memory.
The next calculation uses 16-bit arithmetic, though. In that calculation, 65537 becomes 1, and the number of remaining entries comes out as zero. My model stopped the scan at that point, even though the guest had supplied more buffers.
That explains the otherwise odd byte counts. The model counted two 2060-byte buffers for Gi2, totaling 4120 bytes. For Gi3 it counted three, totaling 6180 bytes. Neither total could hold the jumbo frame being tested, despite the replenished buffers waiting in guest memory.
I changed the model’s comparison to use only the lower 16 bits of the scan position. Now 65537 becomes 1 for that comparison, the cached value gets refreshed, and the scan finds enough space. A small packet also passed because it fit in the buffers counted before the problem appeared. A control test whose counters did not cross 65535 passed as well.
This was still a model of the arithmetic. I had not tested a running QEMU device, and I did not deploy that experimental comparison change. I used it to narrow the source review before testing an existing upstream correction.
The running CML binary reported QEMU 8.2.2 from Ubuntu package 1:8.2.2+ds-0ubuntu1.18. Its package patch directory had no changes to these functions.
I found upstream commit f937309, an existing virtio-net receive-stall correction. It changes the insufficient-buffer notification and retry path. I used that correction for the compiled comparison, keeping it separate from my experimental counter change.
Testing the correction inside CML
I cloned the CML VM and disconnected all 18 copied lab interfaces so the test would stay separate from the running network. In that clone, I built the same Ubuntu QEMU source package twice: once unchanged, then with upstream commit f937309 backported. A backport applies a fix to an older version without upgrading the whole application.
The installed Ubuntu binary did not include QEMU’s qtest accelerator. I enabled it in the source rebuild for the direct regression test. qtest is QEMU’s device-testing framework; it let me test the virtual NIC without booting an entire router for every attempt.
The compiled rx-jumbo-wrap test put an emulated receive queue into each of the three states I had observed. It then queued a jumbo frame, replenished the buffers and notified the device that more buffers were available.
The unchanged build stalled in all three cases. With the patch, the full frame arrived through three successive wraps in each case. I could now reproduce the failure without booting IOS, change the QEMU code, and run the same test again.
Next I booted the cloned SPE3 and SP1 on the patched executable, retaining their IOS XE configurations, virtio NICs, and router MTU 9216. Two isolated Linux endpoints sent traffic through both routers. Five 9000-byte DF pings passed. DF means “Don’t Fragment”: the packet must fit the path without being split into smaller IP fragments, making this a useful MTU check. A six-minute bidirectional TCP run delivered 360 MB in each direction at 8 Mbit/s. Counter sampling across the controls and load test recorded four wraps on each of the four traffic-facing NICs, with no receive stall and no IS-IS flap.
The long TCP test still recorded 15 retransmissions in one direction and 17 in the other. I looked at the live socket counters and found tiny 12-byte retransmissions with duplicate acknowledgments.
Notice the sizes: my test wrote 8960-byte blocks, but TCP negotiated an MSS of 8948. That left a 12-byte tail. I repeated the test with writes aligned to the negotiated MSS. It sustained the same rate for 30 seconds with zero retransmissions in either direction. The write pattern gave me a possible explanation for these short retransmissions, but it did not account for the earlier failures elsewhere in the lab.
The isolated router pair was my canary, a small deployment used to check a change before expanding it. The packet tests passed, so I could move on to live CML. This was still an experimental local backport, not a build supplied by Cisco.
Applying the backport to live CML
The routers were already on virtio, so there was no further NIC-model change to make. I needed them to use the patched QEMU executable on the CML host. An IOS reload would leave that QEMU process running. Each router needed a full CML stop/start.
I recorded the live QEMU package version, the executable hash, and the running domain definitions. The tested executable came from the isolated clone; I verified its SHA-256 again on the live host before installation.
The following is a record of the host change, not a standalone installation recipe. It depends on the exact tested binary, firmware checks, preserved configuration and rollback material. I preserved the packaged executable with a local diversion:
dpkg-divert --local --rename --add \
  --divert /usr/bin/qemu-system-x86_64.distrib \
  /usr/bin/qemu-system-x86_64
I put the patched binary at the normal executable path. Routers that were already running kept their original mapped executable until stopped. To roll back, the script restores the diverted vendor binary, and the affected routers need another stop/start. When a suitable vendor package replaces this local build, the diversion also needs to be removed.
The first patched start on live CML failed before IOS could boot:
could not load PC BIOS 'bios-256k.bin'
Moving the executable to /usr/bin had changed where it looked for firmware. The packaged BIOS was already under /usr/share/seabios; I added the missing firmware links under /usr/share/qemu and recorded them for rollback. After checking the startup path, I retried. The fix here was in the host installation, so there was no reason to change the router’s MTU or IOS configuration.
After correcting the firmware lookup, SPE3 booted on the patched executable. I verified the hash of /proc/<pid>/exe, compared its operational configuration with the saved pre-restart configuration, and checked its control plane. Both IS-IS neighbors and both route-reflector sessions were up. Five 9216-byte DF pings to its SP1 neighbor passed:
Sending 5, 9216-byte ICMP Echos to 10.0.0.16, timeout is 2 seconds:
Packet sent with the DF bit set
!!!!!
Success rate is 100 percent (5/5)
SPE3 was now running the tested binary with its saved configuration and routing sessions intact. I restarted the remaining routers in waves, keeping alternate core and route-reflector paths available. Before moving to the next wave, I checked routing, saved configuration and the executable actually running.
The receive stall was gone, but TCP still failed
Once all 13 routers were running the tested QEMU build, the network started looking healthy again. Their saved configurations were intact, every expected IS-IS neighbor relationship was up, and BGP peers had re-established their sessions. I could reach all 28 network devices. Large packets were getting through too: each of the six directions between the three datacenters passed five 9000-byte pings with fragmentation disabled.
I also went back to the receive-ring counters. During the first live traffic window, I recorded 18 rollovers across ten interfaces, including two that had stalled before. This time reception continued through the rollovers, and the IS-IS logs showed no new neighbor changes. The observation window was short, but it included the condition that had stopped delivery.
The applications began recovering as connectivity returned. All nine K3s nodes reported Ready, and the Grafana and VictoriaMetrics storage volumes reattached automatically. Grafana’s volume recovered all three replicas. VictoriaMetrics was accessible again, but its volume was still degraded while Longhorn rebuilt the missing redundancy.
The pings passed, but the next TCP test still failed. A 1 MiB transfer using small segments timed out at only 1 Mbit/s, with hundreds of retransmissions.
I reduced the transfer to 256 KiB and compared small and jumbo segments. The small-segment replay still failed, with 117 retransmissions recorded at one endpoint and 95 at the other. The jumbo replay moved the same amount of data in both directions in about 2.2 seconds without a single retransmission. I had requested an MSS of 1200 for the small test and 8960 for the jumbo test; the latter negotiated to 8948 bytes.
The QEMU stall was no longer appearing, but small-segment transfers were still failing. I stopped the planned sustained throughput test and captured the smaller transfer as it crossed the leaves.
Finding the second fault at the leaf
I captured the failing transfer at both K3s guests, Proxmox and EVE. To follow those captures, take a look at what EVE creates when I draw a connection between two virtual devices.
For the QEMU-based nodes in this lab, EVE connects virtual Ethernet ports through host-side TAP interfaces and bridges. A TAP interface is a software Ethernet endpoint: QEMU reads and writes Ethernet frames through it on behalf of a guest NIC. A bridge joins those endpoints into a Layer 2 network, much like a small Ethernet switch. A simple internal connection has this shape once the nodes are running:
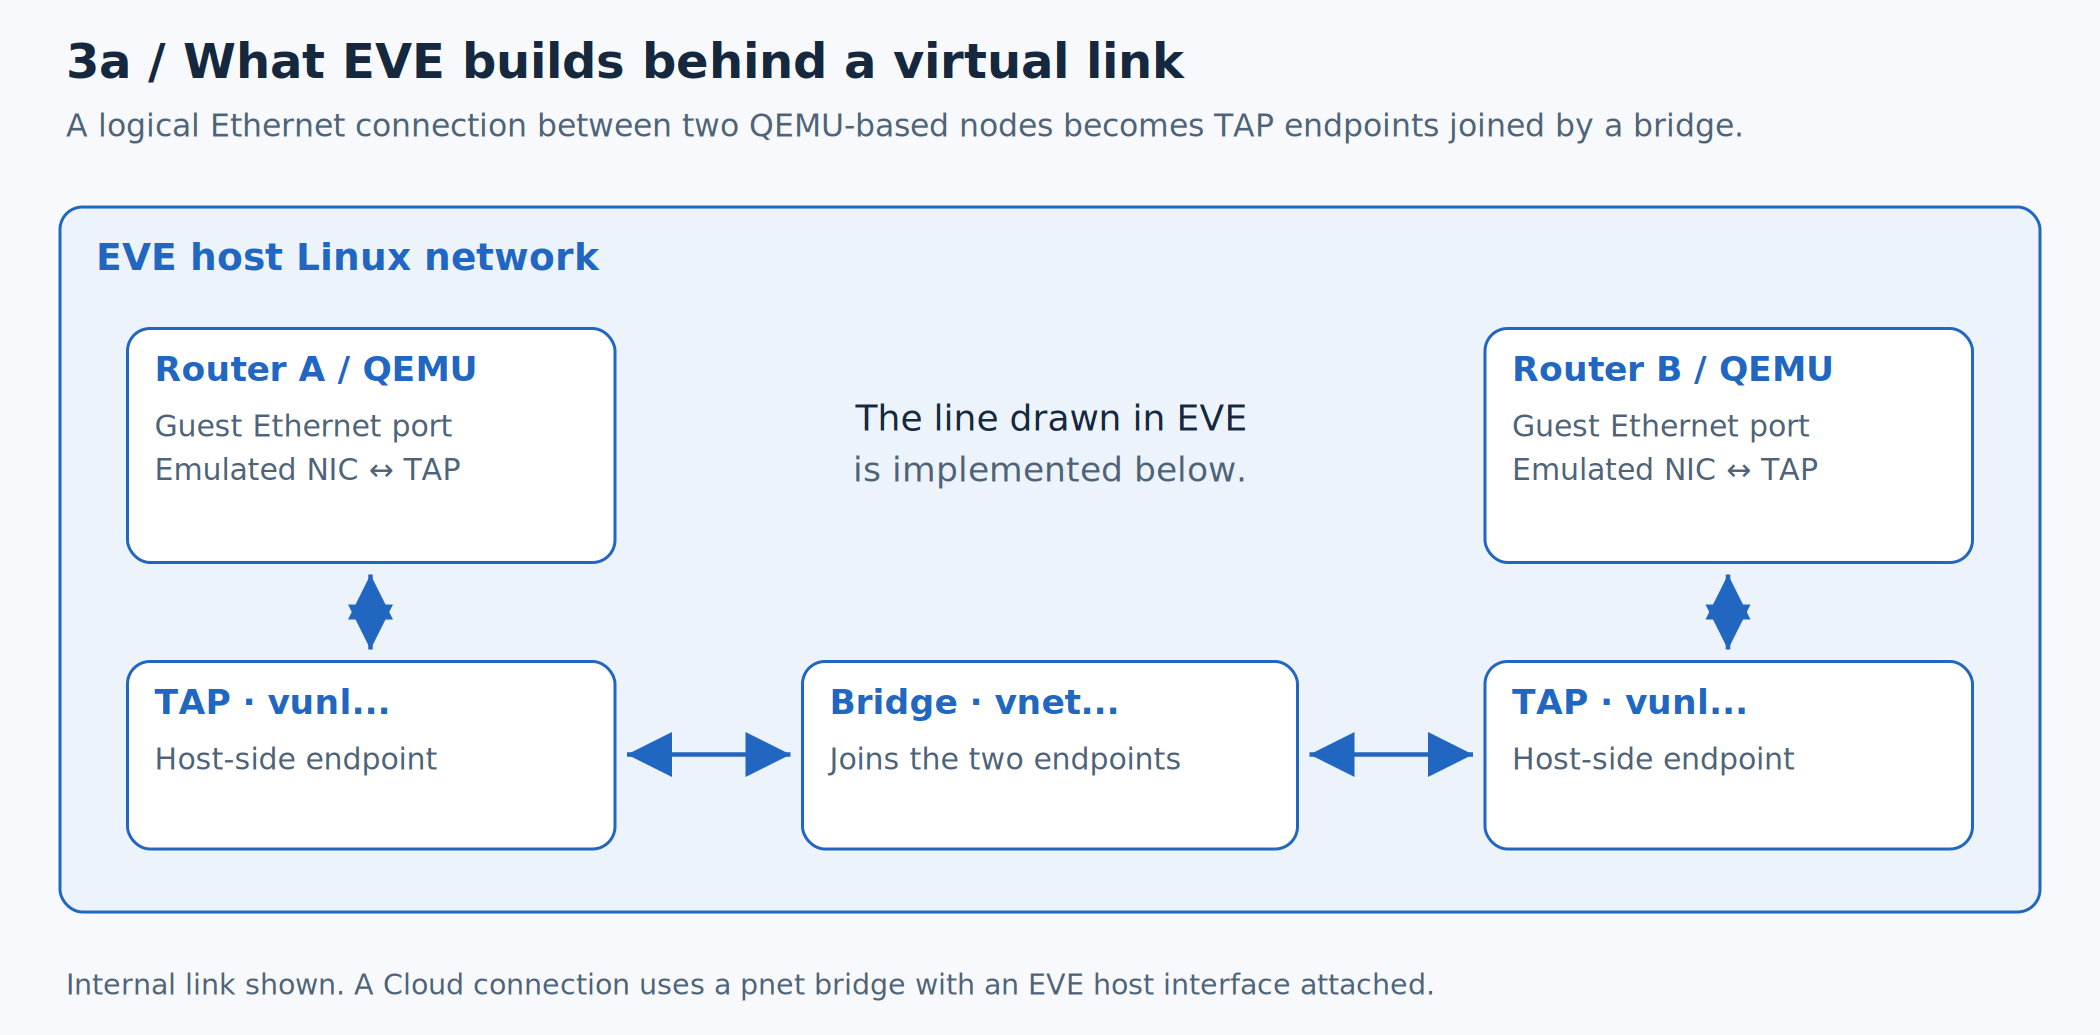
Figure 3a. The connection in the topology editor becomes a path through QEMU, TAP interfaces and a host bridge.
The vunl interfaces are the host-side endpoints, not the bridges themselves. An internal lab network uses a bridge named vnet... in this setup. An external Cloud connection attaches to a pnet... bridge, which also connects to an interface of the EVE host. That external path is how my K3s VMs on Proxmox reach the EVE-hosted leaves. The lab interconnect guide records that wiring.
Here is the mapping for DCA-Leaf01, EVE node ID 3. Its host interface vunl0_3_5 backs Ethernet5, and vunl0_3_2 backs Ethernet2. The final number is the interface index in this node’s mapping. Inside vEOS, the corresponding Linux NICs are vmnicet5 and vmnicet2.
These are names for the two sides of the same VM connection: vunl... on the EVE host and vmnicet... inside the switch. I needed the host-side names for my captures and the guest-side names when changing offload settings.
The saved EVE interface map shows Ethernet5’s TAP attached to pnet11, alongside the EVE host’s eth11. Ethernet2’s TAP belonged to vnet0_11, alongside vunl0_2_1, the peer spine’s TAP. For the traffic direction I was investigating, the path was:
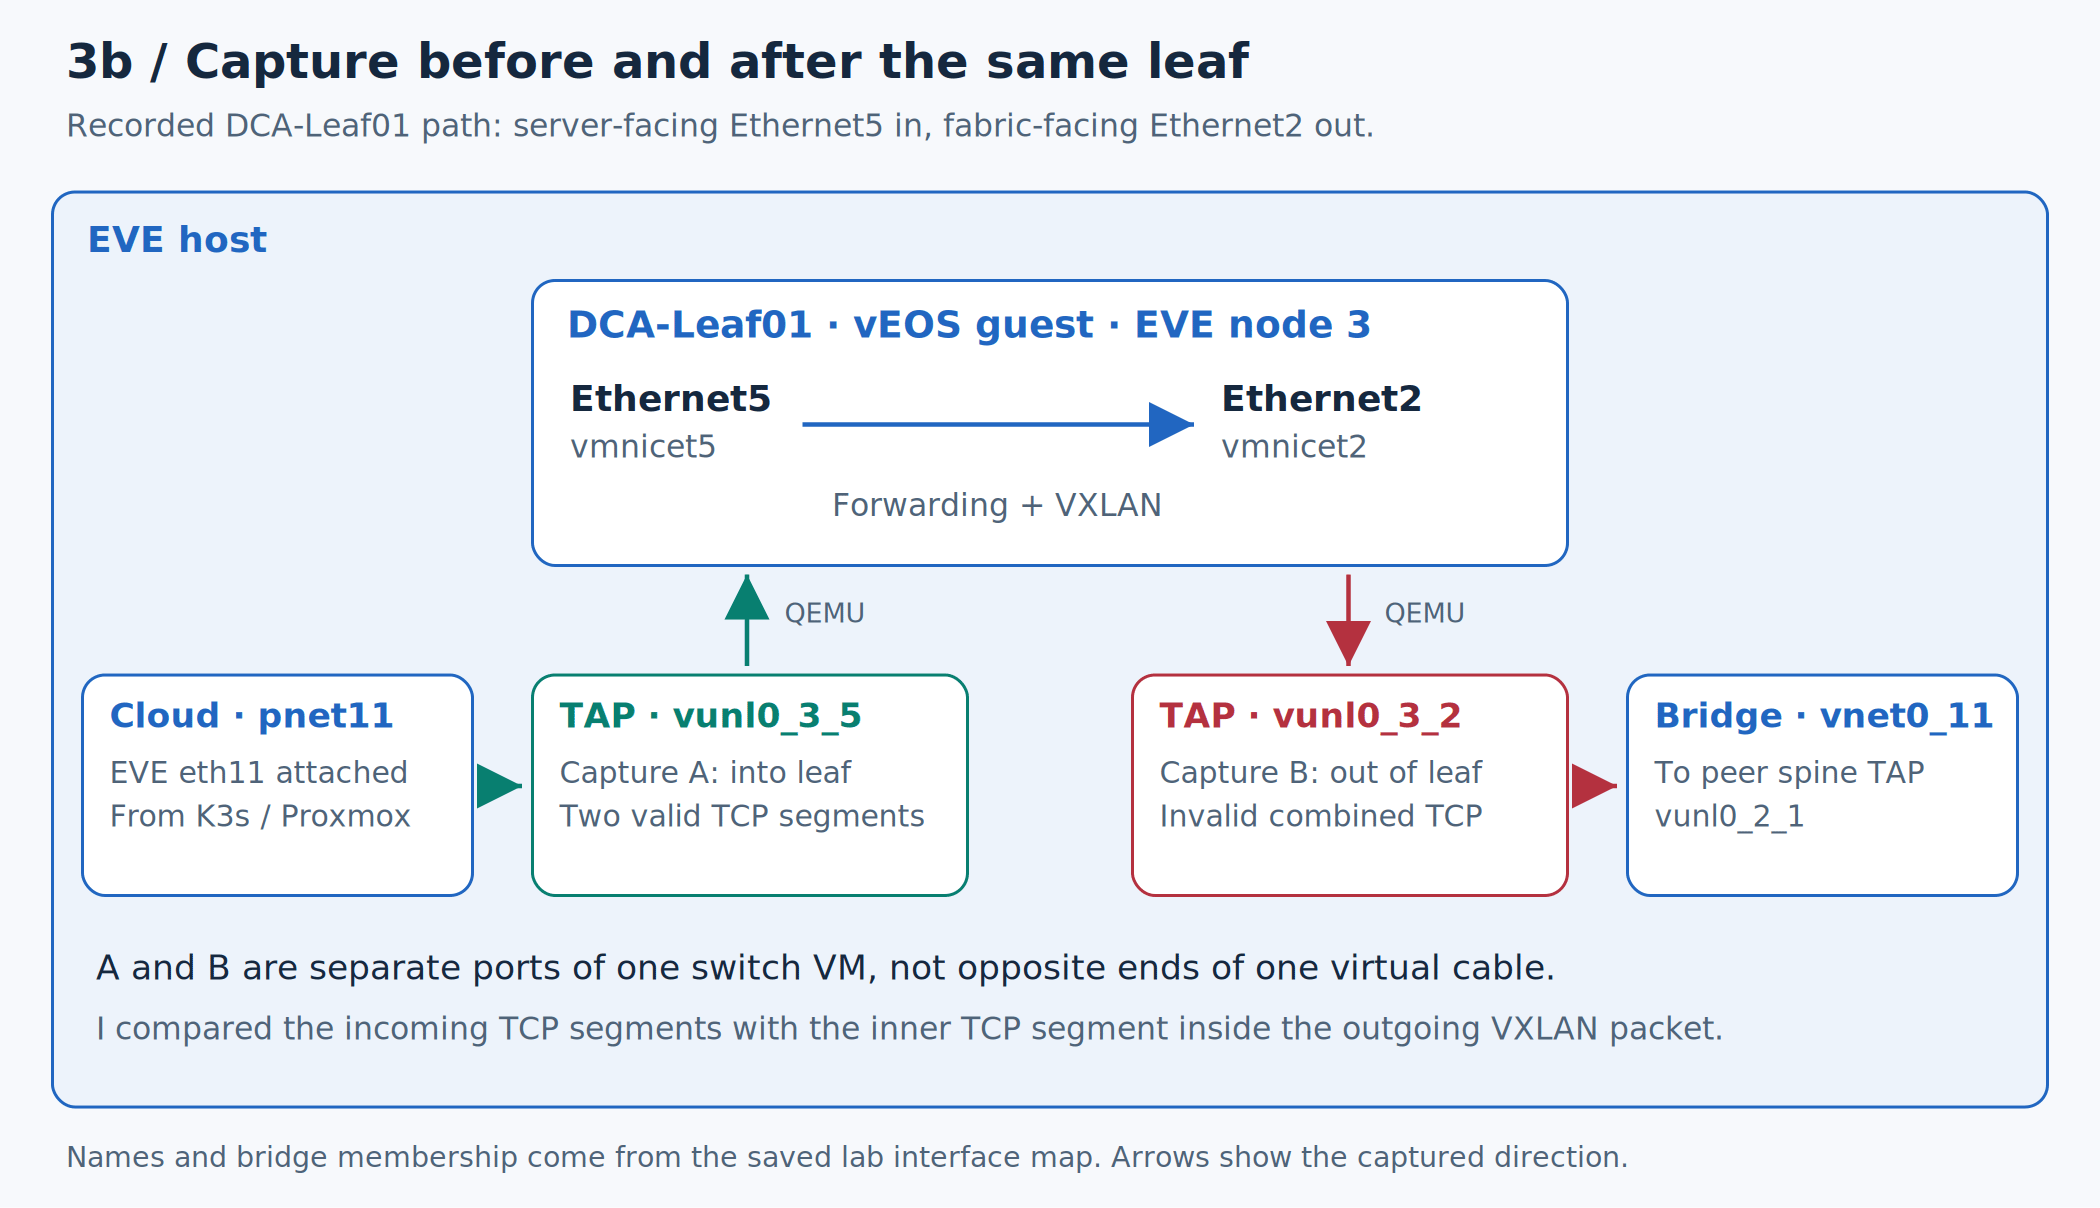
Figure 3b. I captured traffic at two host-side TAPs around the same leaf. The labels map each capture to its guest port and bridge.
I was capturing two ports on DCA-Leaf01. At vunl0_3_5, I could see the packet arriving at the server-facing Ethernet5 port. At vunl0_3_2, I could see what left Ethernet2 toward the fabric. The outgoing packet had a VXLAN wrapper, so I compared the TCP packet inside it with the one that had entered Ethernet5.
On the EVE host, these read-only commands expose the relevant bridge membership:
bridge link show dev vunl0_3_5
bridge link show dev vunl0_3_2
ls /sys/class/net/pnet11/brif
ls /sys/class/net/vnet0_11/brif
Look for master in the bridge link output. That tells you which bridge owns the interface. The brif directory lists the other interfaces attached to that bridge. The names above belong to this lab instance, so check the mapping before using them as capture points in another lab.
Now look at the sequence numbers in the capture. A TCP sequence number identifies where a segment’s data starts in the stream. The second segment starts 1188 bytes after the first, exactly the length of the first payload.
After the leaf forwarded them, those two 1188-byte payloads had become one 2376-byte payload starting at the original sequence number. Combining segments is not automatically a fault. The problem was that the combined packet had an invalid checksum, the integrity check covering the TCP header and data.

I had used a known repeated byte for the test payload, which let me reconstruct the payload and verify its checksum against the captured headers. The invalid combined segment also appeared at the receiving host. About two seconds later, valid 1188-byte retransmissions arrived, and the receiver acknowledged those bytes.
That last check matters with offload captures. A checksum can look wrong in a sender-side capture before the NIC finishes processing it. Here, I could follow the malformed segment to the receiving host and then see the valid retransmissions arrive.
Both source leaf ingress NICs had generic-receive-offload: on: DCA-Leaf01 vmnicet5 and DCB-Leaf01 vmnicet4. Generic Receive Offload, or GRO, combines received segments to reduce processing work. Segmentation and checksum handling later in the path must still produce valid packets.
I had valid packets arriving at the leaf and an invalid combined packet leaving it. Disabling GRO on those two ingress NICs gave me a specific change to test against that capture.
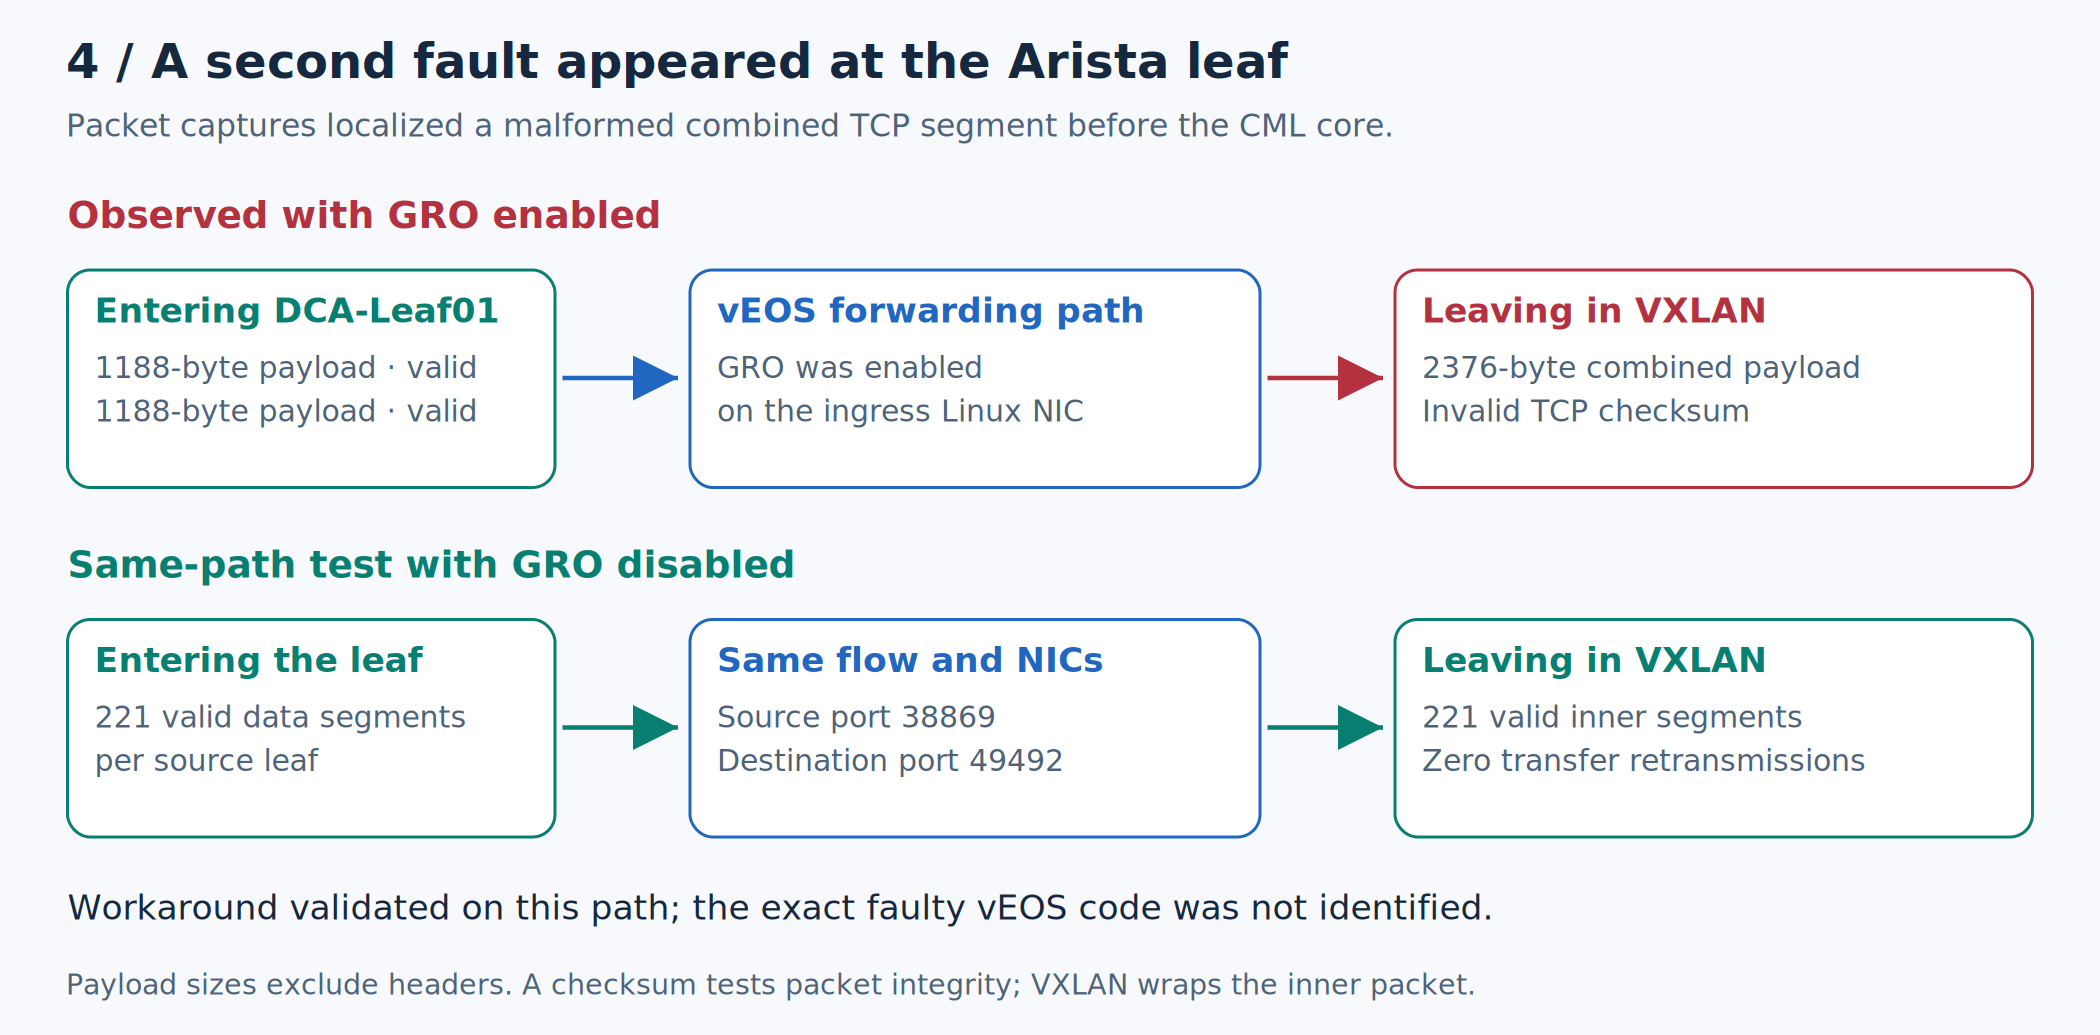
Figure 4. I compared the packet before and after the leaf. The lower row previews the controlled test described next: preserving the path was essential to testing the workaround.
The packet captures and parsed results are available in the repository.
Testing GRO on the actual TCP path
I temporarily disabled GRO on DCA-Leaf01 vmnicet5 and DCB-Leaf01 vmnicet4, checking each setting before and after:
# On DCA-Leaf01
bash sudo ethtool -K vmnicet5 gro off
bash ethtool -k vmnicet5

# On DCB-Leaf01
bash sudo ethtool -K vmnicet4 gro off
bash ethtool -k vmnicet4
I ran the replay again and it still failed, with 136/140 retransmissions. Then I checked the captures. The new connection had entered Leaf02 at both sites. I had changed Leaf01.
The K3s hosts use bonds, which group multiple NICs into one logical interface. Their balance-xor mode uses a layer3+4 hash: IP addresses and transport ports determine which member carries a connection. Changing the TCP source port can therefore send a replay through another leaf even when its destination stays the same.
That is what happened here. The small-segment replay bypassed both modified ingress ports. Its paired jumbo replay passed with zero retransmissions, but neither result tested the change I had made on Leaf01.
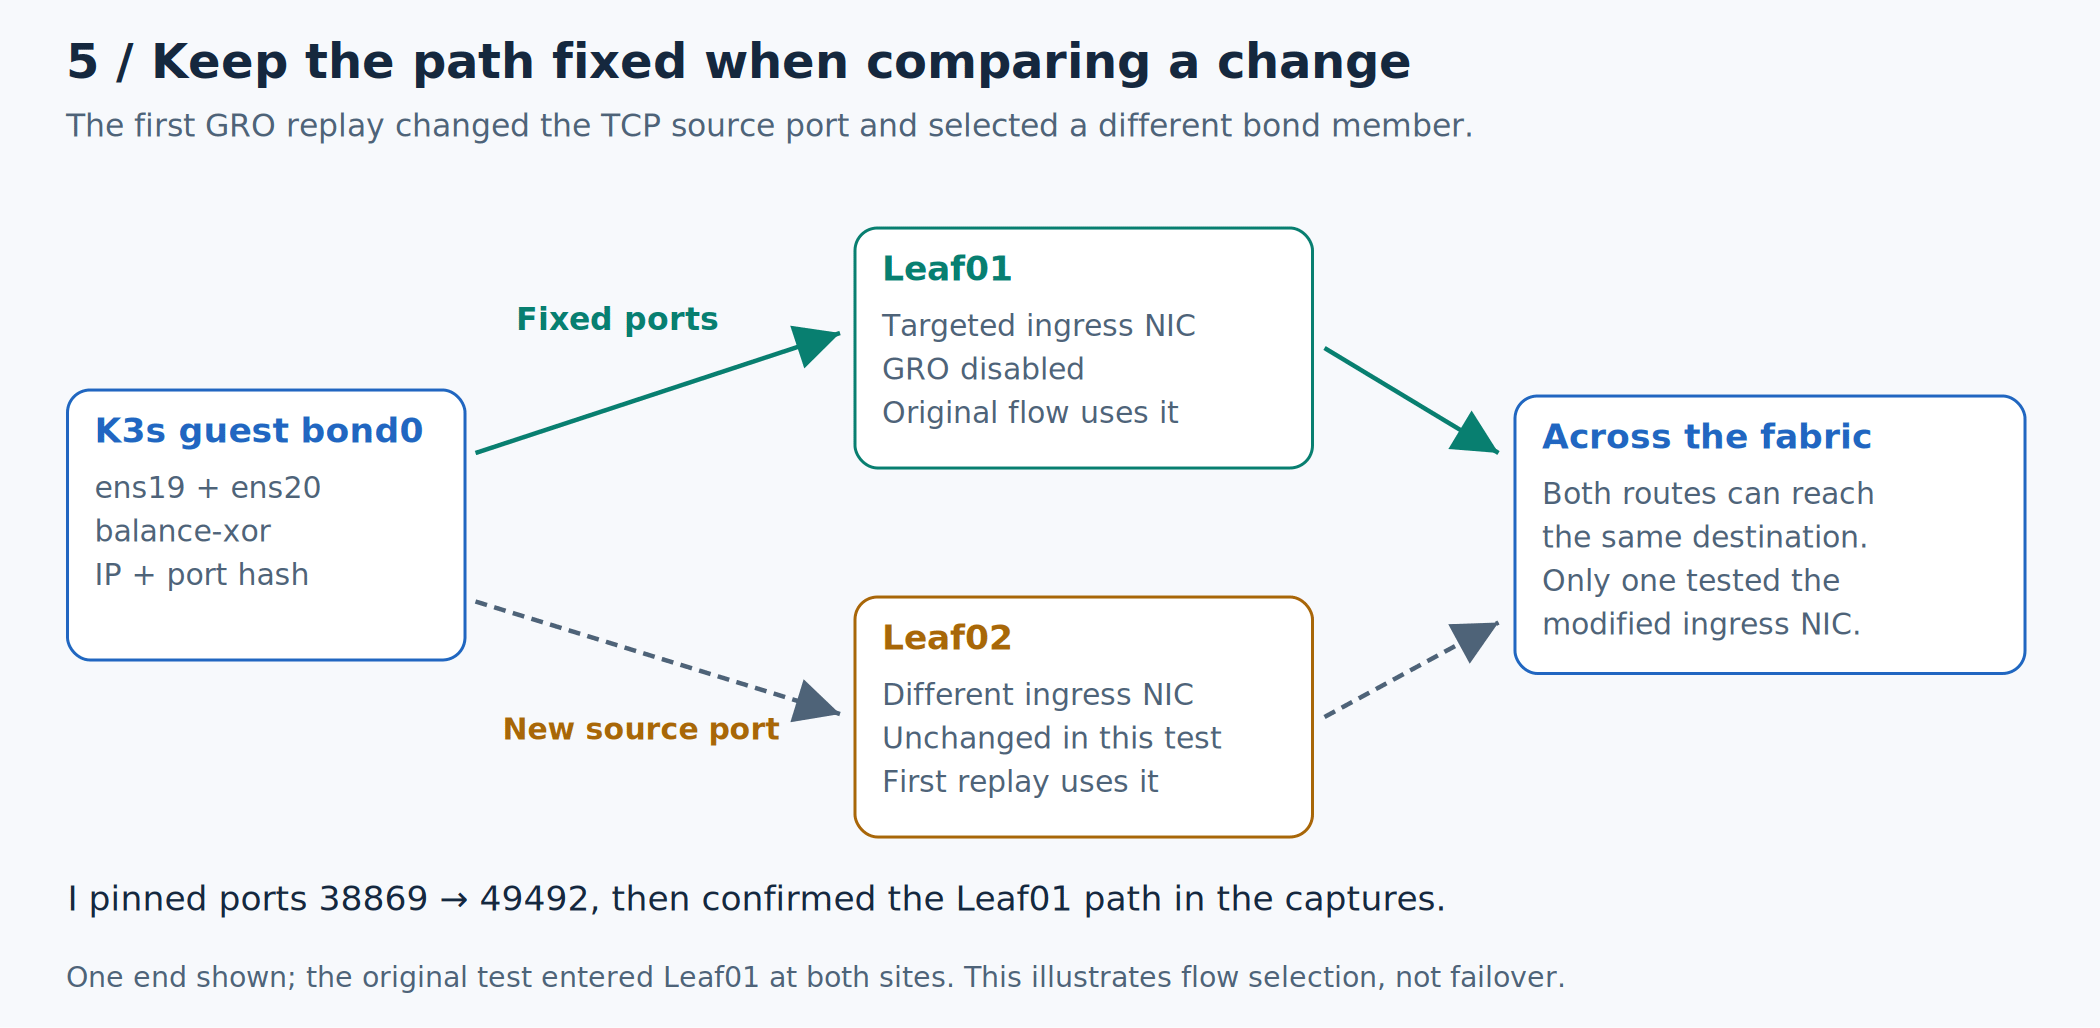
Figure 5. I had changed Leaf01, but the first replay used Leaf02. Fixing the ports and checking the captures put the comparison back on the modified path. One end is shown; the same issue occurred at both sites.
I repeated the small-segment test with the original source port, 38869, and destination port 49492. Captures confirmed the original ingress path through DCA-Leaf01 and DCB-Leaf01. This time, 256 KiB transferred in each direction with matching SHA-256 hashes and zero retransmissions. Both directions completed within about 2.5 seconds.

I checked the captures again. Each source leaf received 221 valid data segments and emitted 221 valid inner TCP segments in VXLAN. The malformed combined segments from the baseline were gone at those capture points.
Turning GRO off worked on this path. I had not located the faulty code inside vEOS, and I still needed to test the other leaves and workloads.
After that temporary test, I put GRO back to on on both ports and checked the readback. The QEMU correction stayed deployed. I still needed to generate a persistent GRO configuration for the leaves and check the other paths.
Rolling the correction across the leaves
I needed the setting to survive beyond a shell command. I added a device context listing the ten modeled Ethernet data NICs on each of the nine leaves, then generated an EOS event handler for each NIC. An event handler is a saved action triggered by an event, in this case startup.
The source is golden-config/templates/eos/platform.j2, which reads the lab_gro_workaround context. I published the correction after 82 template/structure tests and 149 Batfish/config checks passed. Here is the handler for vmnicet5:
event-handler lab-gro-off-vmnicet5
   action bash sudo -n /sbin/ethtool -K vmnicet5 gro off
   trigger on-boot
   delay 60
EOS runs the on-boot handler after configuration as well as at boot. That gave me two things to inspect: ethtool -k for the current Linux offload state, and startup configuration for the saved instruction. I checked both during the rollout. I did not cold-boot the leaves.
DCA-Leaf01 passed first. I then deployed to the remaining leaves in two waves, comparing each plan with Nautobot’s fresh intended configuration. On each leaf I checked the current offload settings and the saved startup handlers.
On DCC-Leaf02, GRO was already off on all ten NICs, but only nine startup handlers had been saved. The switch was in the state I wanted at that moment; one interface was missing the instruction intended to restore that state after a reboot. Netmiko, the library sending the configuration commands, had reported Pattern not detected: 'end' in output. With Fail Job on Task Failure enabled, that incomplete deployment remained visible as a failure.
I read DCC-Leaf02 again and built a recovery plan containing only the missing handler. After deploying it, I read back all ten saved handlers. The fleet then had GRO off on all 90 data NICs, with a saved handler for each. An actual cold boot was still needed to test their startup execution.
I repeated the small-segment transfer and checked the leaf captures. The TCP checksums were valid at the observed boundaries, and the malformed combined segments were gone from that replay. Routing was up across the fabric. The transfer completed with matching data, zero retransmissions at one endpoint and one at the other.
I widened the test to include all nine K3s hosts and every site pair. All nine bidirectional transfers completed, but their endpoints recorded 41 retransmissions in total. A separate three-minute transfer also completed, with two retransmissions at one end and eight at the other. Packet delivery had improved enough to finish these transfers; it had not become consistently free of retransmissions. With Longhorn already rebuilding a volume, I held off on adding a higher-rate traffic test.
K3s showed all nine nodes and 65 pods Ready in the recorded samples. The first 23-minute comparison had no increase in container restarts. Later, four of Longhorn’s storage-integration containers restarted, so I went back to the volume that was rebuilding.
The clearest remaining failure came near the end of a VictoriaMetrics replica rebuild. It reached 97%, then stopped with a read/write timeout and connection resets. Longhorn automatically replaced the failed replica and tried again, but another attempt reset too. Grafana’s storage remained healthy. The GRO workaround had corrected the malformed packets in my captures, yet it had not made this storage transfer reliable.
CE2 and CE3 were carrying roughly 17–18 Mbit/s against a configured 20 Mbit/s throughput limit, so I checked whether the rebuild was running out of forwarding capacity. The sampled forwarding and queue counters did not show that limit causing drops. The endpoints did not show CPU or memory exhaustion either. I could not explain the resets from those checks, so I moved on to the connection Longhorn was losing.
Testing how quickly the rebuild connection gave up
The rebuild was getting almost to the end before its connection reset. Longhorn coordinates that work through remote procedure calls, or RPCs, between storage processes. I wanted to see how long the TCP connection carrying those calls would wait when packets stopped getting through.
I inspected the sockets owned by the live rebuild processes. They had TCP_USER_TIMEOUT set to 20 seconds, with TCP keepalive enabled after 15 seconds of inactivity and a 15-second interval between unanswered probes. I read those values from the running connections instead of assuming the chart defaults were in use.
TCP_USER_TIMEOUT limits how long TCP will tolerate data remaining unacknowledged, or buffered without being sent. It also affects when an idle connection with unanswered keepalive probes is closed. The interaction mattered here: a short interruption could miss a probe, and restoring the network would not necessarily rescue the connection before its timeout logic ran.
I tested that possibility in an isolated Linux network namespace, which gave me a separate network environment where I could deliberately drop packets. I introduced a five-second loss window covering the first keepalive probe, then let traffic through again. I ran the same experiment with a 20-second user timeout and a 60-second user timeout, changing only that setting.
By the check at about 35 seconds, the 20-second connection had reported ETIMEDOUT, Linux’s connection-timeout error. The 60-second connection was still open and could exchange data after the interruption. The loss window was the same; the longer timeout gave that test connection enough time to recover.
I had tested one connection under a controlled loss window. That did not reproduce a whole Longhorn rebuild or tell me what was dropping packets in the lab.
I raised the user timeout on specific live rebuild RPC sockets as a temporary mitigation. Those changes lasted only as long as the connections stayed open; they were not saved Longhorn settings.
Both application volumes eventually recovered three read/write replicas. I could confirm that they were healthy again, but I could not say the timeout change alone had done it. I still needed to find the cause of the interruptions and decide whether a permanent Longhorn timeout change was appropriate.
Could I trust the next successful test?
Once Longhorn finished rebuilding, I ran the small-segment and jumbo checks again. A reboot had already given me a temporary recovery earlier in this investigation, so I wanted to repeat the transfers that had exposed the failures.
Before starting, I checked the running QEMU binaries and the leaf offload settings. All 13 router processes matched the tested build, and all 90 leaf data NICs still had GRO off. Both CML socket samples had clear receive queues. Routing was up, both application volumes had three healthy replicas, and the cluster snapshots showed no pod replacements or increase in container restarts.
The small-segment transfers completed across nine host pairs, covering every K3s node and every site pair. The data matched at both ends, with zero retransmissions. Jumbo transfers across three site pairs also completed with matching data and zero retransmissions. Large pings passed in all six inter-site directions.
I then kept a jumbo transfer running for three minutes at 1 Mbit/s in each direction. It delivered just over 22.5 million bytes each way, with matching hashes. One endpoint recorded no retransmissions; the other recorded four. The original receive freeze had not returned, and the small-segment tests were working, but the longer run still gave me a reason to keep looking. None of these deliberately paced tests established the network’s maximum capacity or replaced a cold-boot check of the leaf handlers.
The remaining problem showed up under load
The short transfers were working. Then I looked at a cross-site Longhorn connection under storage load: roughly 3 MiB retransmitted out of 31 MiB sent, with a reported round-trip time around 734 ms. I still had a problem to investigate.
The routing logs supplied another clue. Before the repeat tests, BFD had triggered BGP session resets, including one between DCA-Spine01 and DCB-Spine02. BFD is a rapid failure detector: if its probes stop getting through in time, it can tell BGP to tear down a session. The most recent session recovered in roughly two seconds, but the message Cease/BFD down <Hard Reset> did not tell me why the probes had been missed. Packet loss and scheduling delays were possibilities to investigate, not conclusions from that log alone.
The QEMU and GRO changes stayed in place because their failure cases were now passing. I still needed to correlate Longhorn traffic with the BFD resets and run a sustained load test. The saved verification evidence contains the process checks and traffic samples for that work.
Where I would start next time
I would start with the failing connection and map its actual path. On CML, I have the router’s interface counters, the host socket queues and QEMU’s receive-ring state to compare. In EVE, I can capture the packet before and after the leaf and check that it leaves with the same valid TCP data.
I also need to keep the test addresses and ports fixed. Changing the source port sent the first GRO replay through another leaf. It looked like the setting had done nothing until I checked which interfaces the new flow was actually using.
The lab was working well enough to finish the short transfers and recover storage, but the load-related retransmissions and routing resets still needed attention. In From Network Devices to Grafana: Building the Lab’s SNMP Pipeline, I bring the network’s interface counters into Grafana so I can follow those measurements while the applications use the network. That post also covers the event-collection gap: polling counters will not capture every brief BFD or BGP transition.